
Appearance
Resource Guardian
Menu: Operations Center → Resource Guardian
Deep link:/_Admin/system/resource-guardian?SiteId={siteGuid}
Monitor static resource requests and bandwidth for a site: bandwidth by file type, resource composition and access ranking, live request list, bot traffic, and hotlink / unauthorized scraping protection. Enable resource logging first; stat cards and charts load only after that. The Site Protection switch controls whether off-site referrers are blocked per protection rules.
Permission
Same menu permission as Visitor Logs: visitorLog (view). Enable Operations Center → Resource Guardian in Edit Menu.
How to Open
- In Edit Menu, enable Operations Center → Resource Guardian.
- Open Operations Center → Resource Guardian on the left.
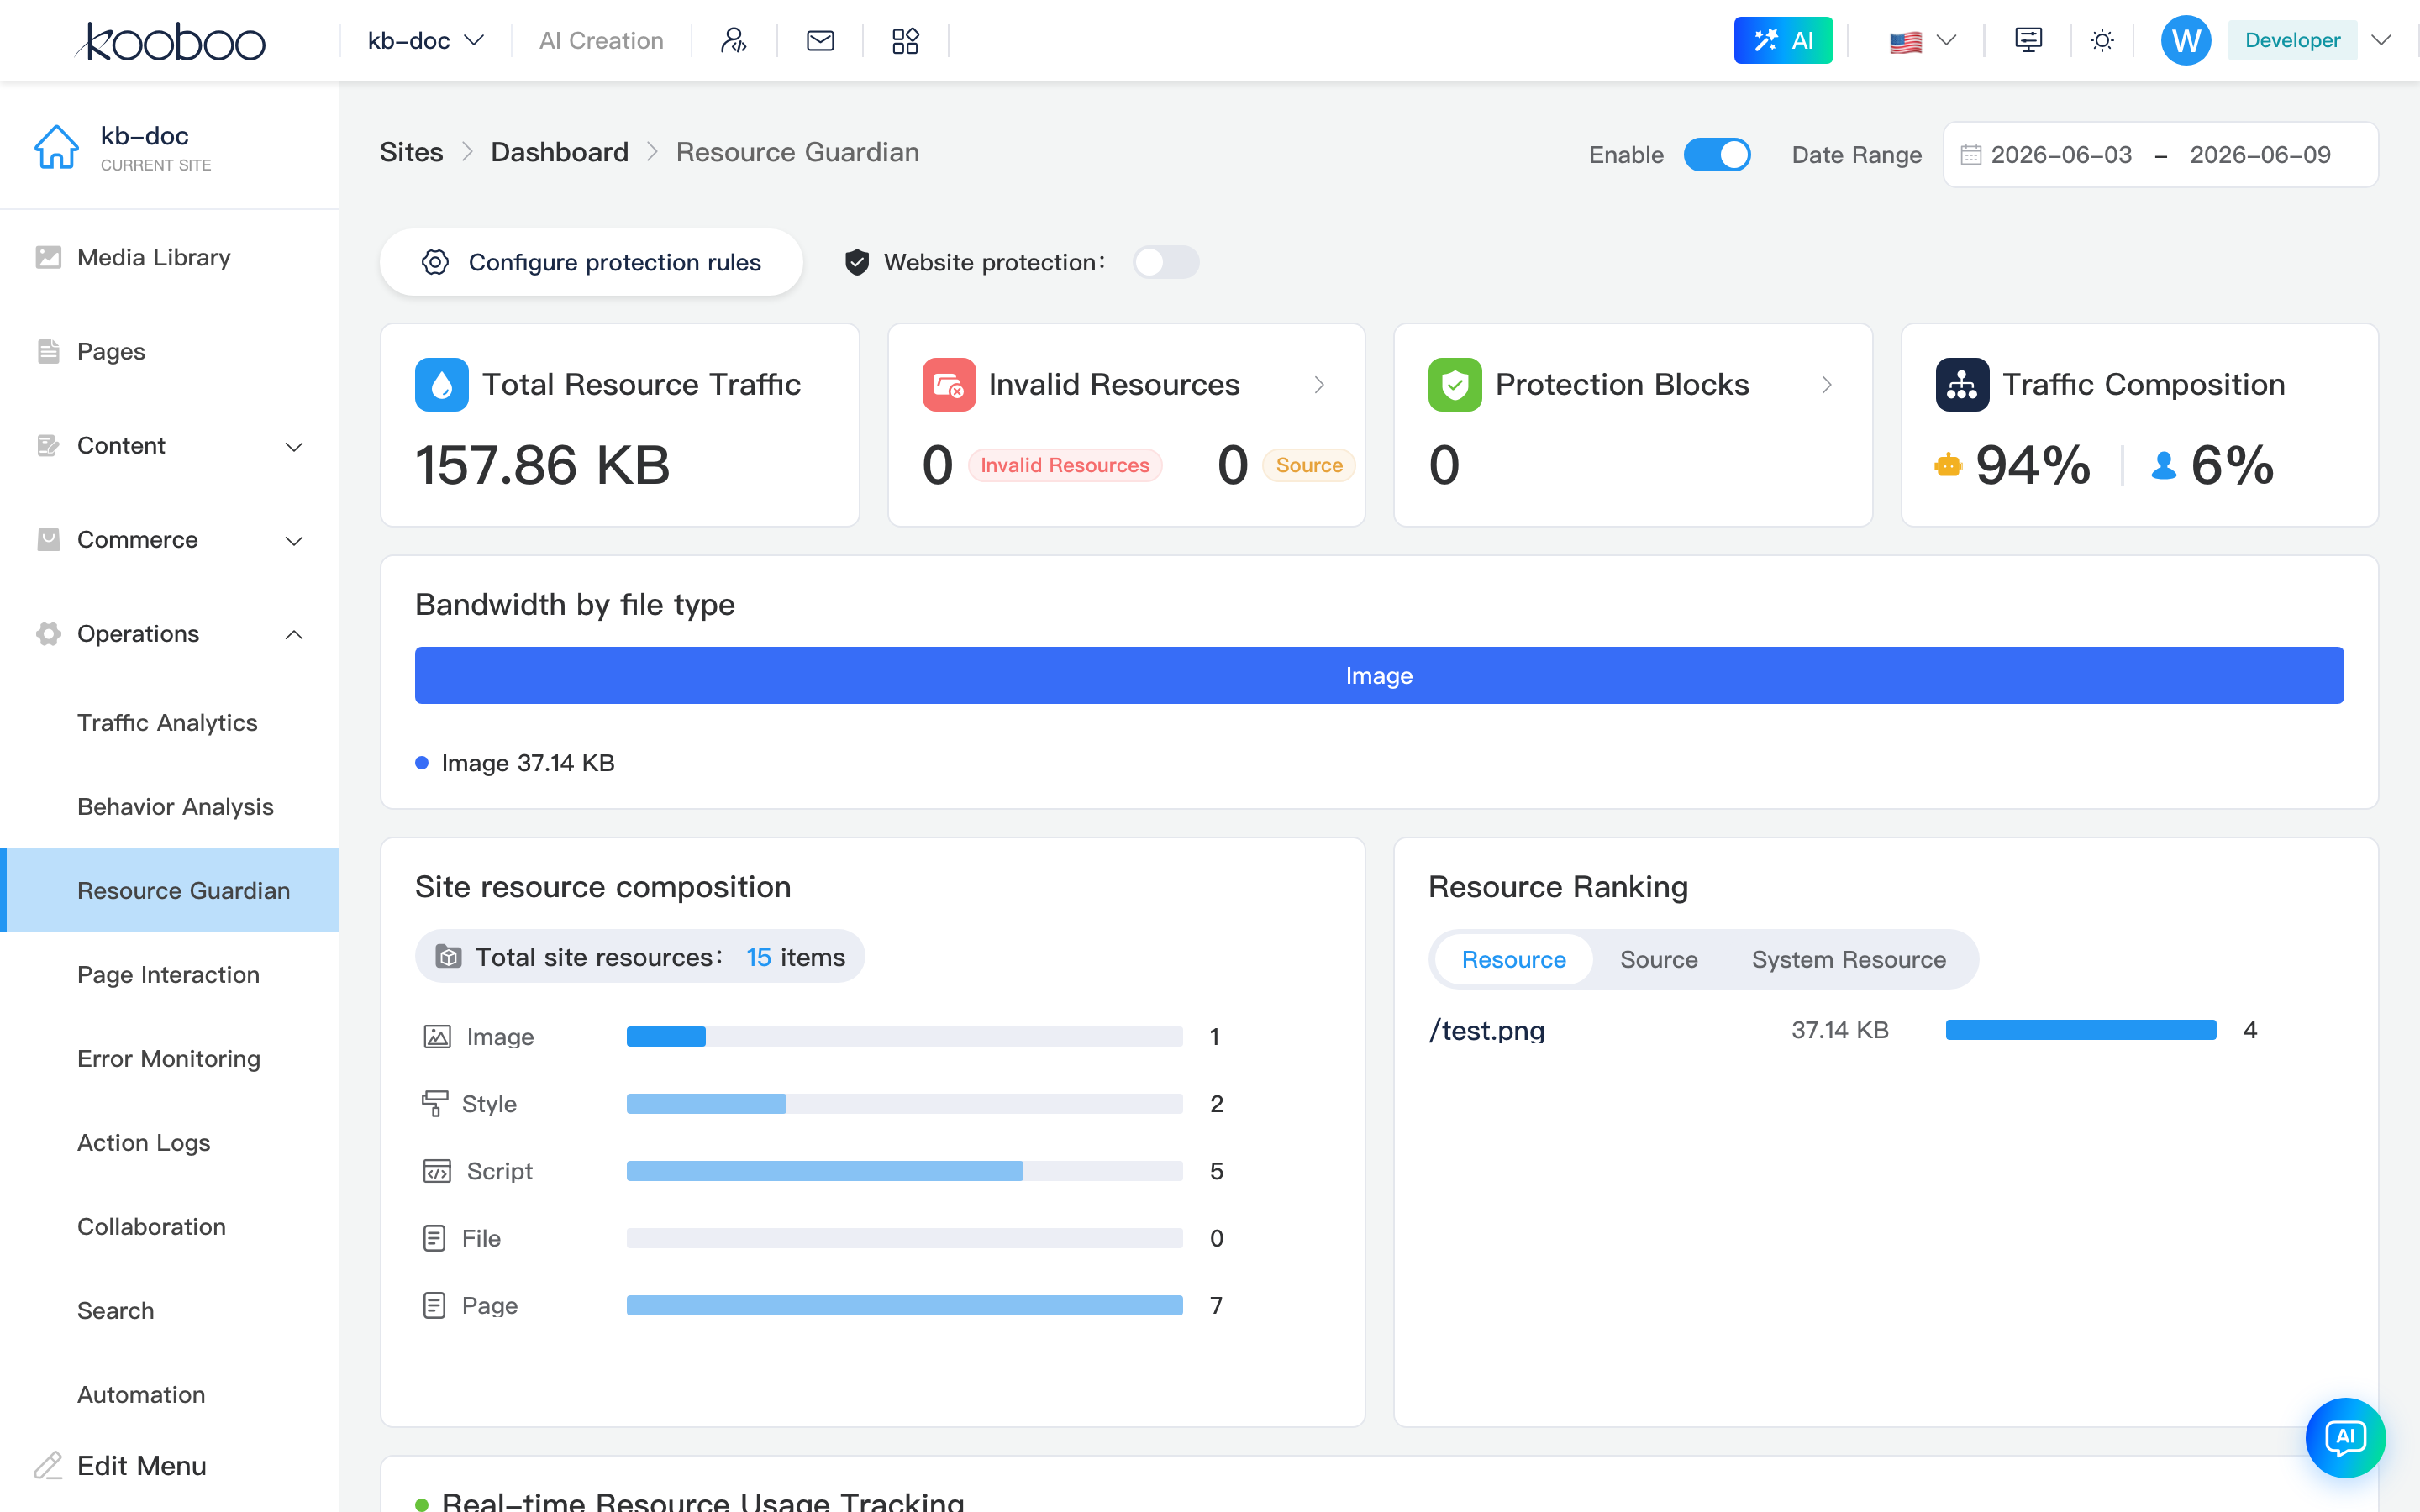
After entry, the main screen flows top to bottom: header controls, protection entry, metric cards, bandwidth analysis, resource composition and ranking, live log, bot intelligence, external site list; sections below include screenshots.
Header
Path: /_Admin/system/resource-guardian?SiteId=...
| Control | Description |
|---|---|
| Enable | enableResourceLog; when off, stats clear and only protection config entry remains |
| Date Range | Global userBehaviorDateRange (shared with behavior analysis, etc.); changing it refreshes ResourceLog/Info |

Protection Entry
| Control | Description |
|---|---|
| Configure Protection Rules | Go to Protection Rules (resource-guardian/protection-rules) |
| Site Protection | enableGuardian; when on, off-site requests are handled per rules (block / redirect / watermark, etc.) |

Overview Metrics (Four Cards)
Shown after resource logging is enabled and a date range is selected:
| Card | Description |
|---|---|
| Total Resource Traffic | Total bandwidth of resource requests in the interval |
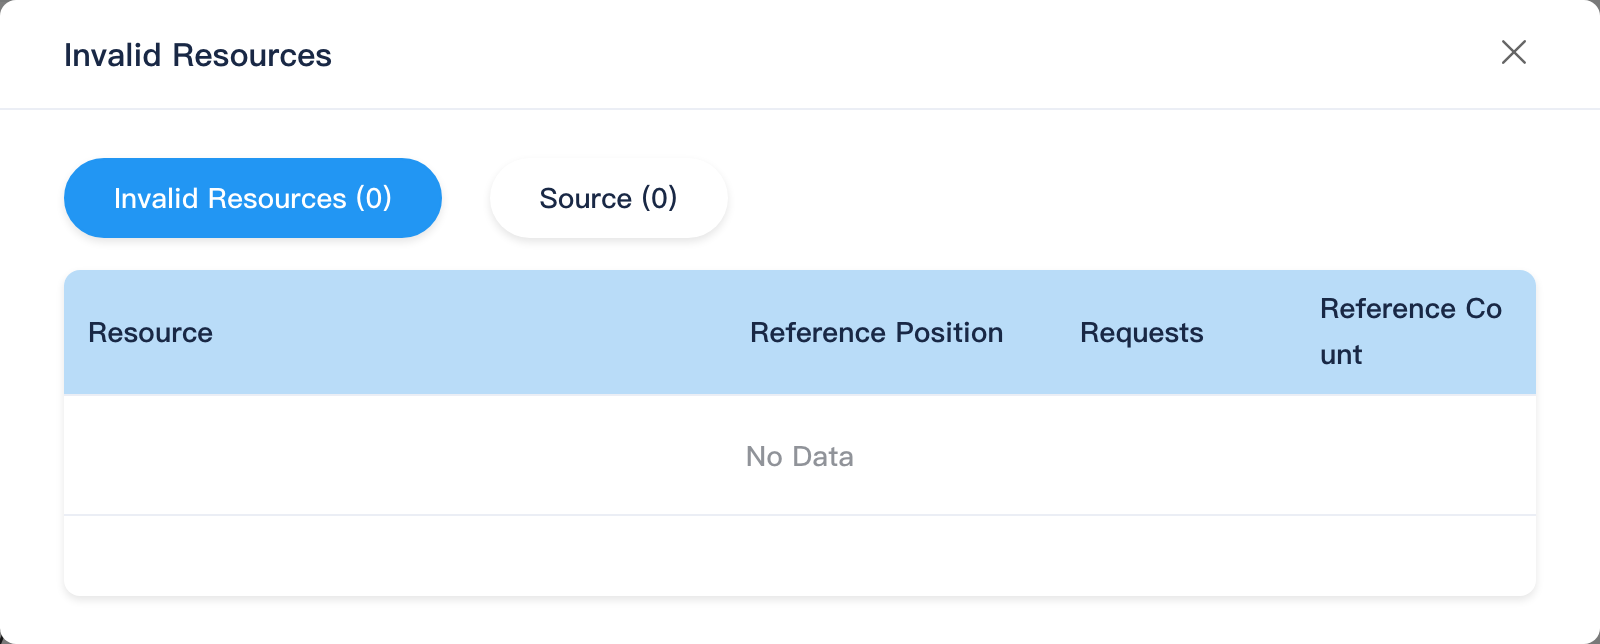
| Invalid Resources | 404 etc. resource count + referrer page count; click card for detail dialog (Resource / Referrer tabs) |
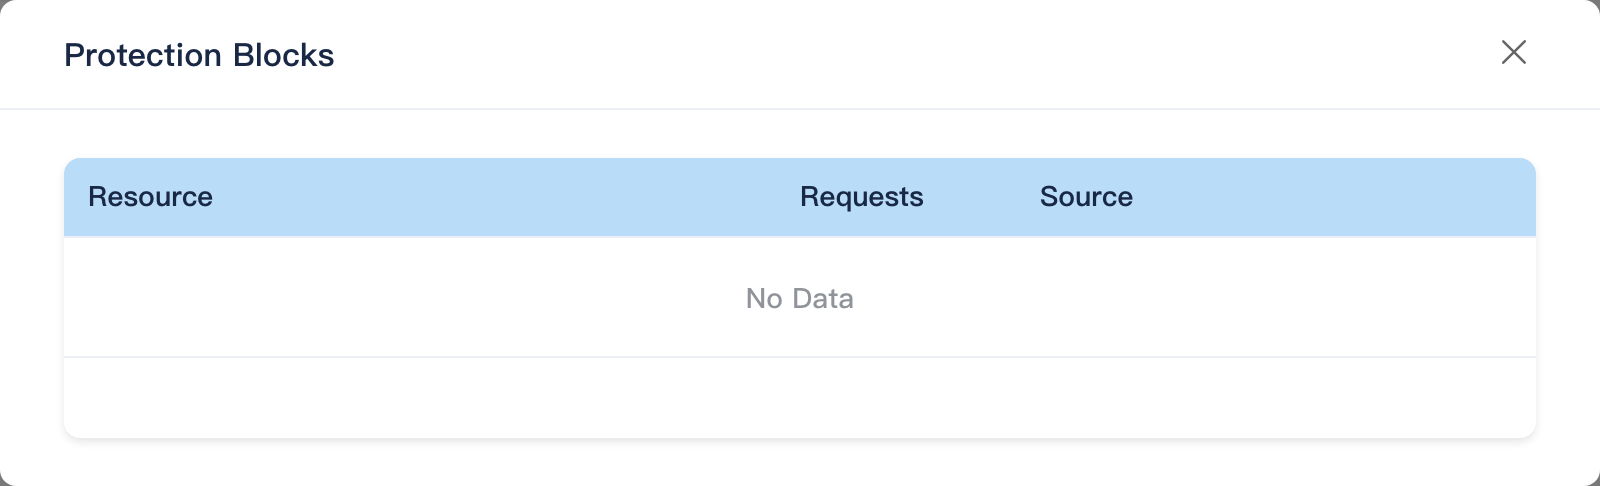
| Protection Blocks | Requests blocked by protection rules; click card for blocked resource list |
| Traffic Composition | Bot vs human share (machineRate / humanRate) |

Invalid Resources Dialog
After clicking Invalid Resources, switch Invalid Resources / Referrer for Top lists: resource URL, usage location, request count, referrer count, etc.
Protection Blocks Dialog
After clicking Protection Blocks, the table lists blocked resources, request count, and main referrer domains.
Bandwidth Analysis Block
Horizontal stacked bars and legend by file type: bandwidth share and actual size per type (bandwidthByFileType). Hidden when there is no data.

Site Resource Composition and Resource Ranking
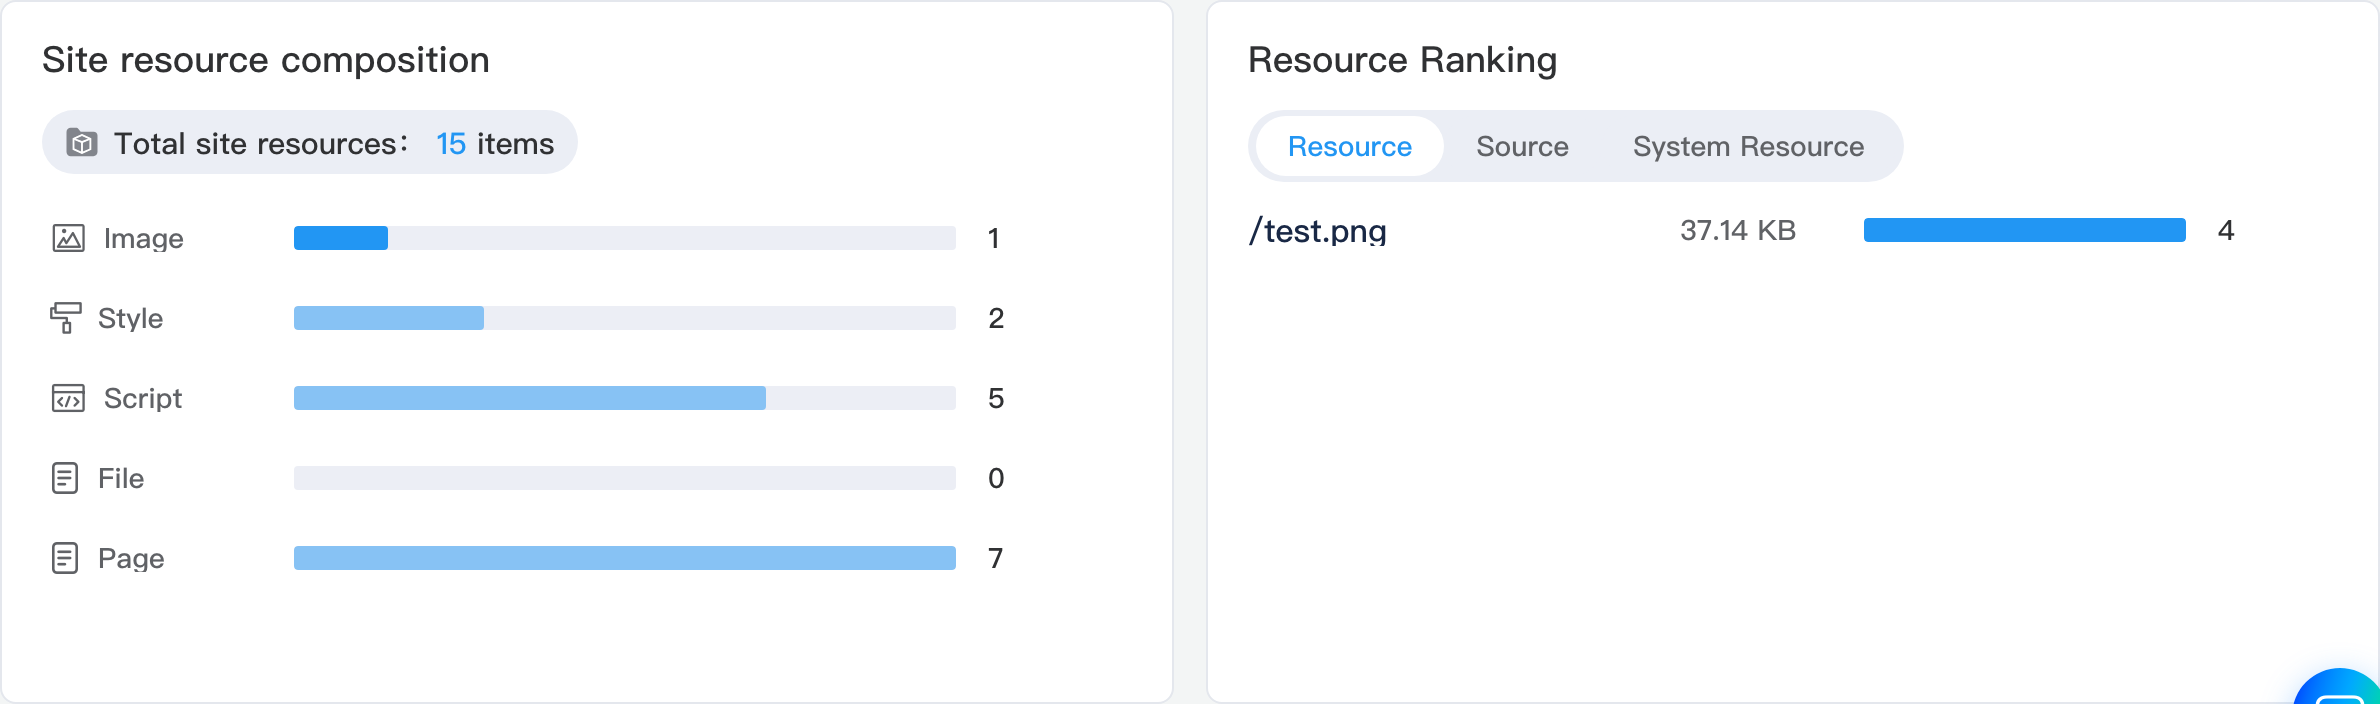
Two columns in one row:
| Block | Description |
|---|---|
| Site Resource Composition | Image, script, style, file, page counts and share bars |
| Resource Ranking | Tabs: Resource / Referrer / System Resource; bar chart sorted by request count; open resource links |
Live Resource List and Usage Tracking
Main table shows ~5 live records: Resource URL, Referrer, Request Location, Usage Analysis (bandwidth, request count); expand for links to pages/views, etc. View Live Data → Resource Log subpage.

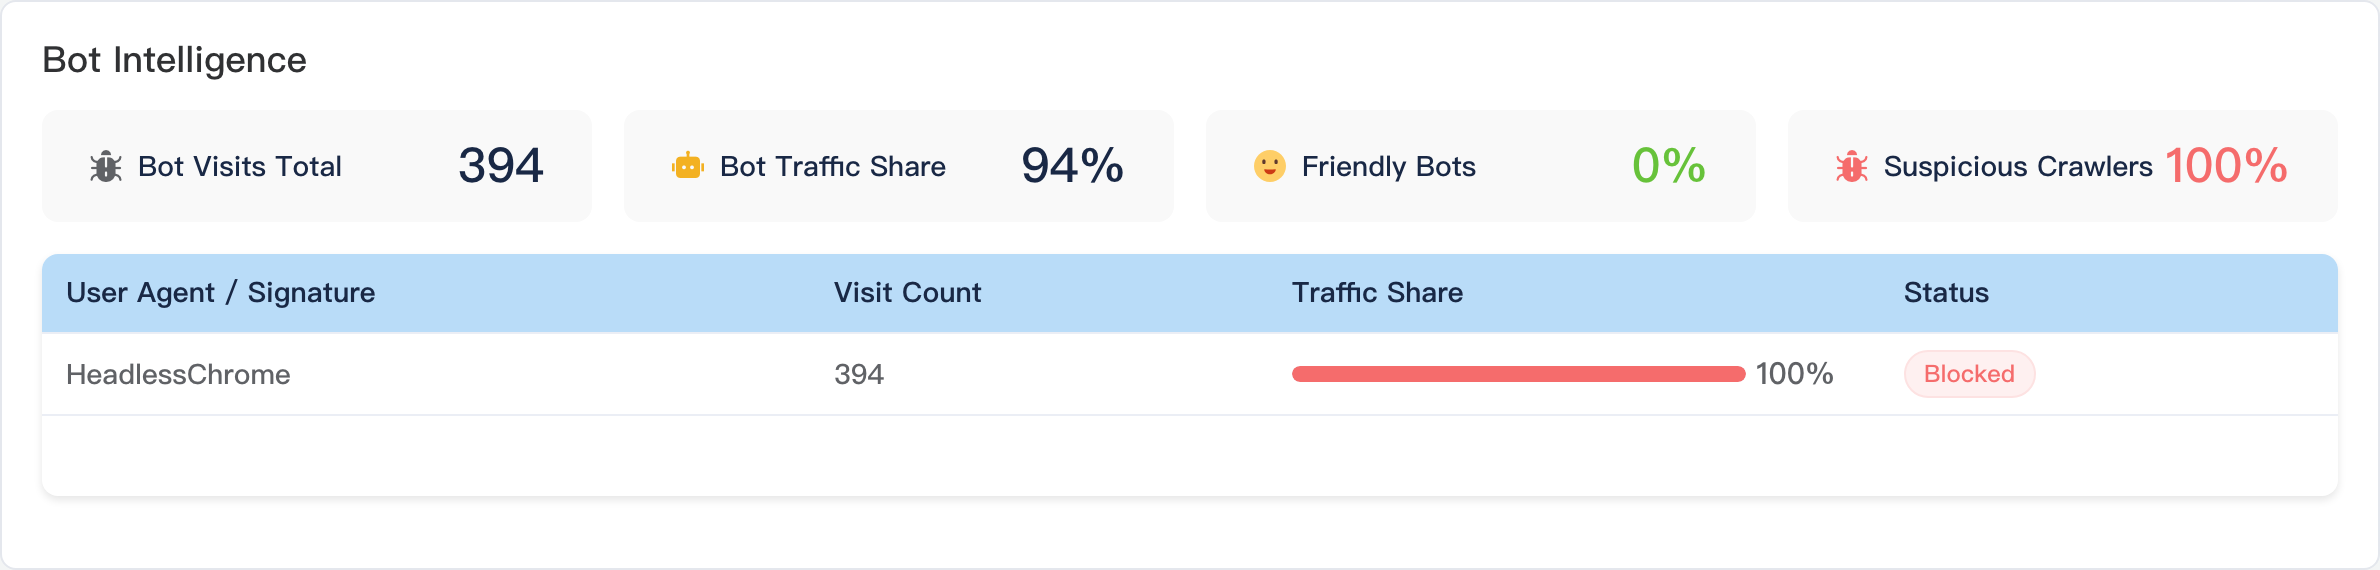
Bot Intelligence Analysis
Same component as Visitor Logs: botInfo summary for resource requests (~5 rows on main screen).
External Sites Using Your Resources
Table of external domains: Site Domain, Request Count, Bandwidth Usage, Status (Blocked / Allowed). Use to detect hotlinking or abnormal off-site references.

Subpages
Protection Rules Subpage
Path: /_Admin/system/resource-guardian/protection-rules?SiteId=...
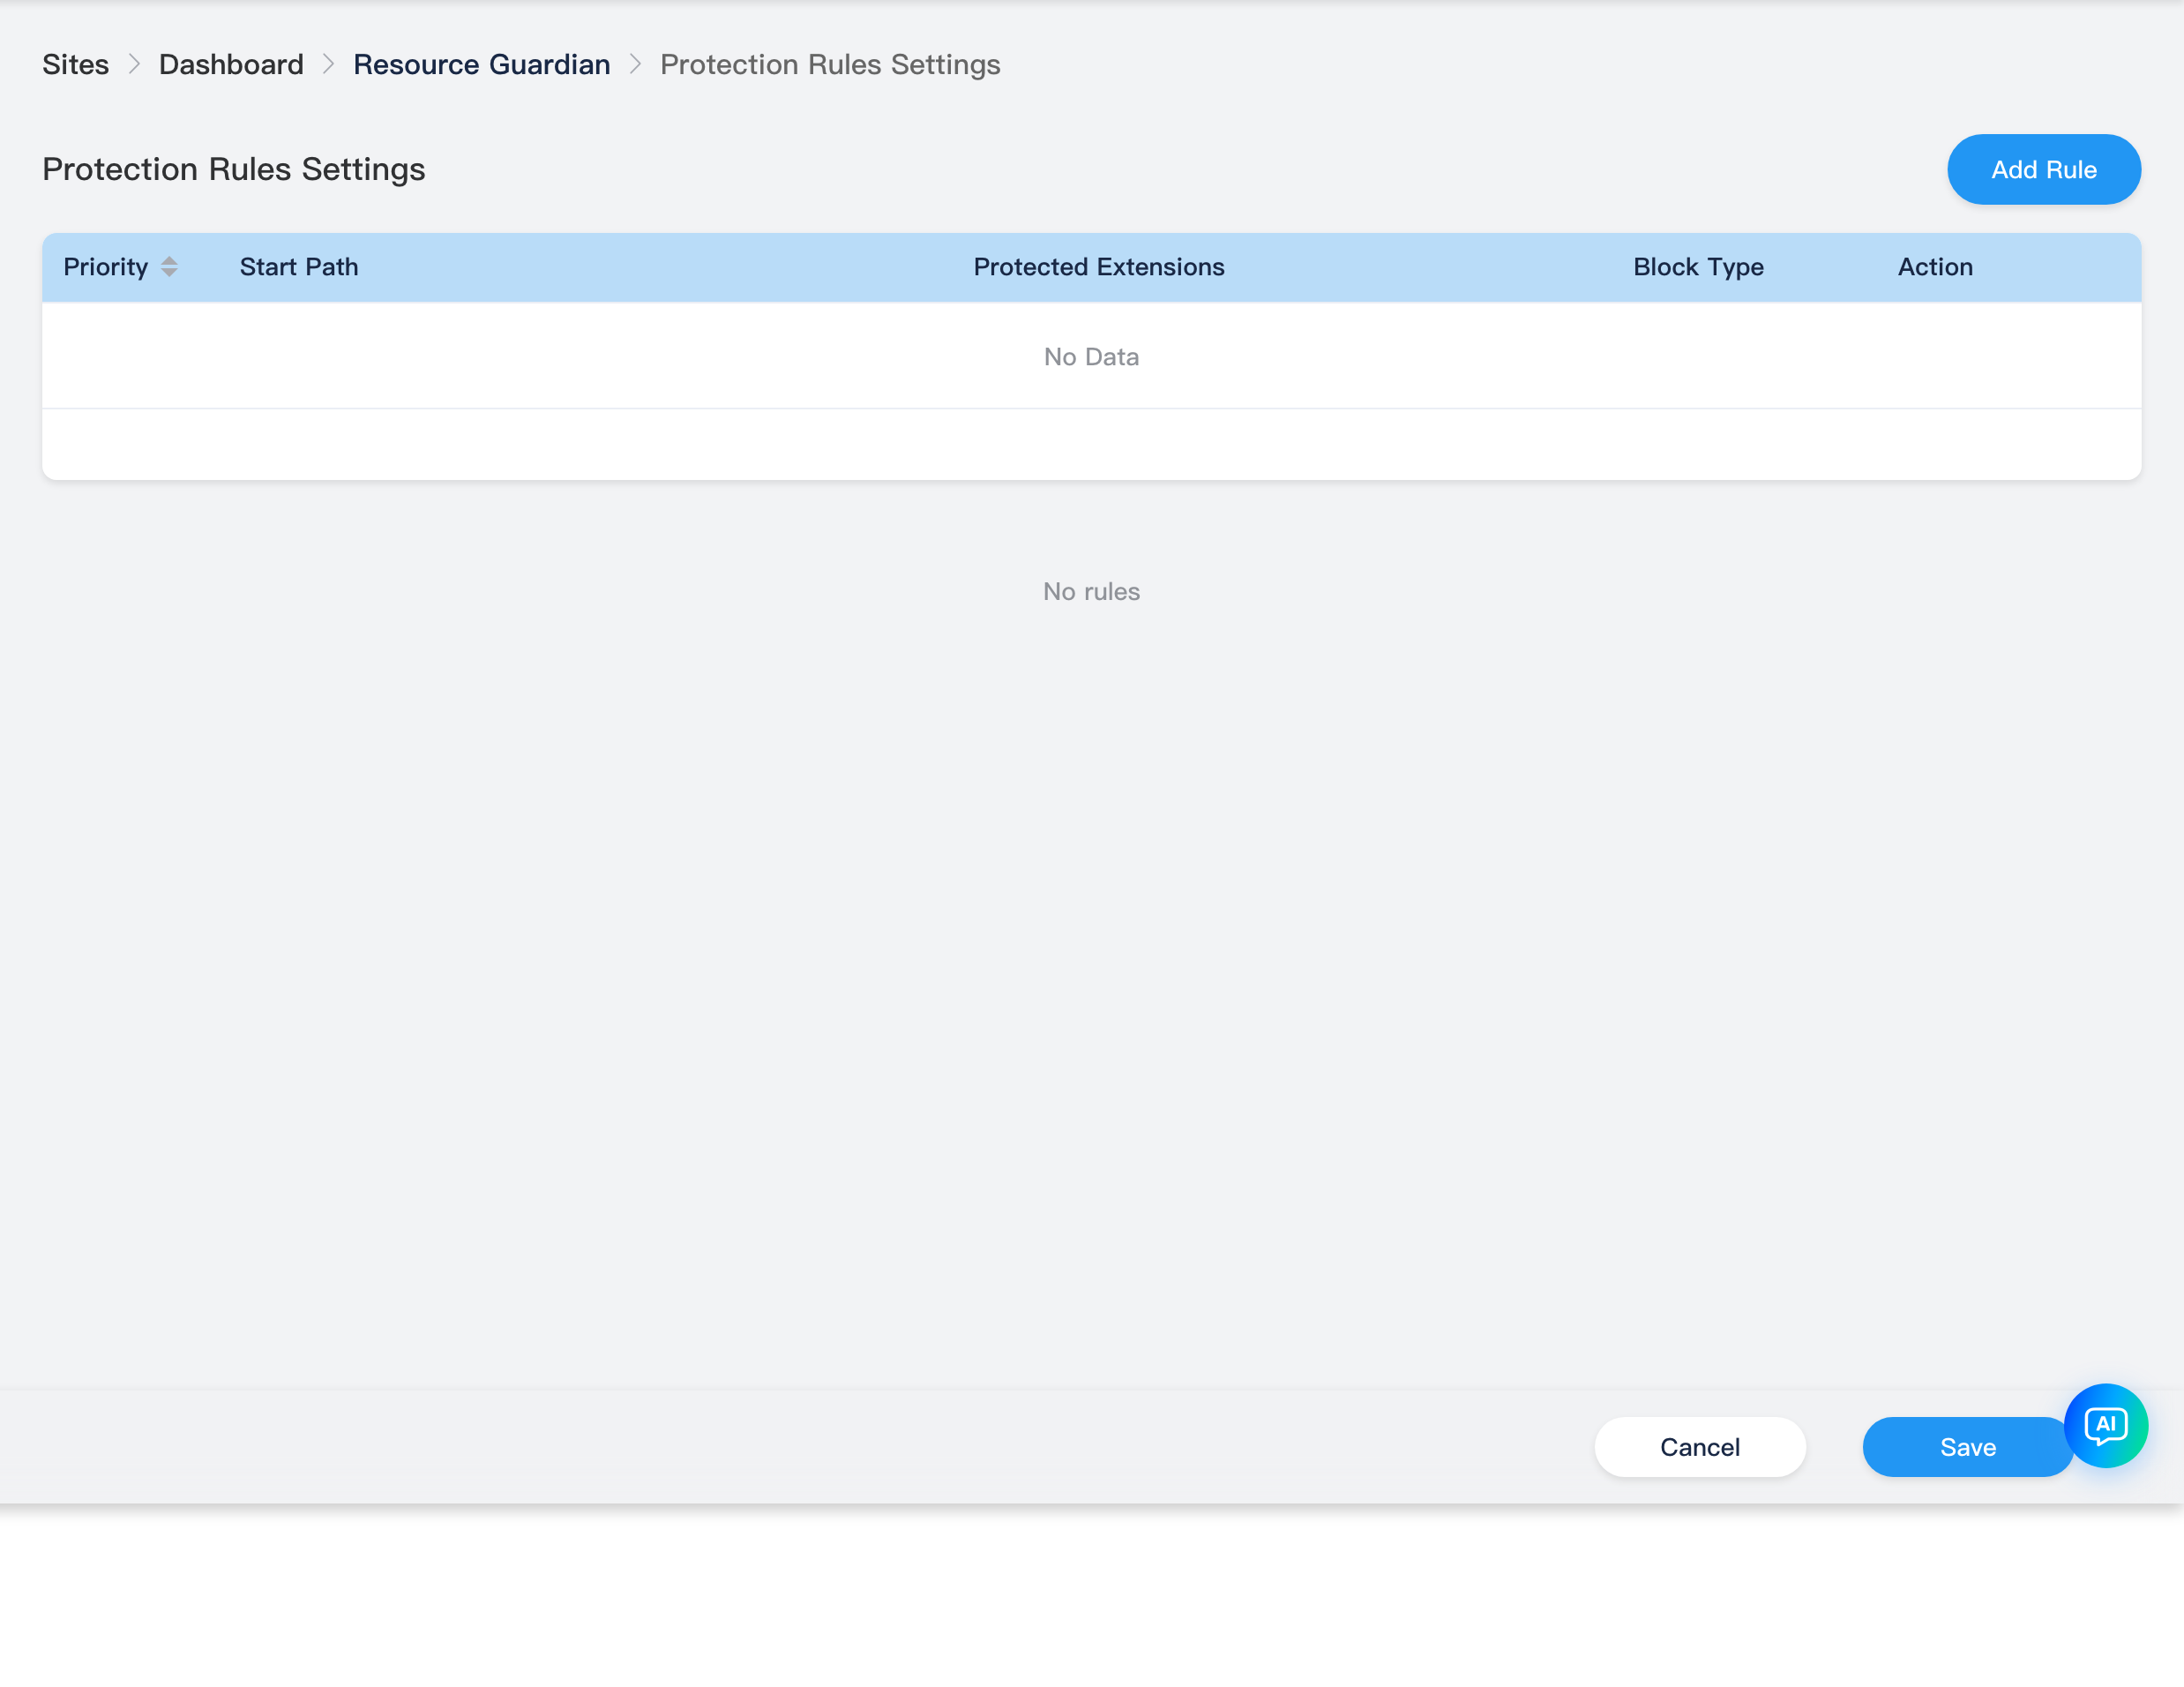
Breadcrumb: Resource Guardian → Protection Rules. Rule table fields: Priority, Start Path, Protected Extensions, Block Type (hard block 403 / redirect / watermark); row Edit, Delete. Add Rule opens dialog. Footer Save writes ResourceLog/UpdateSetting.
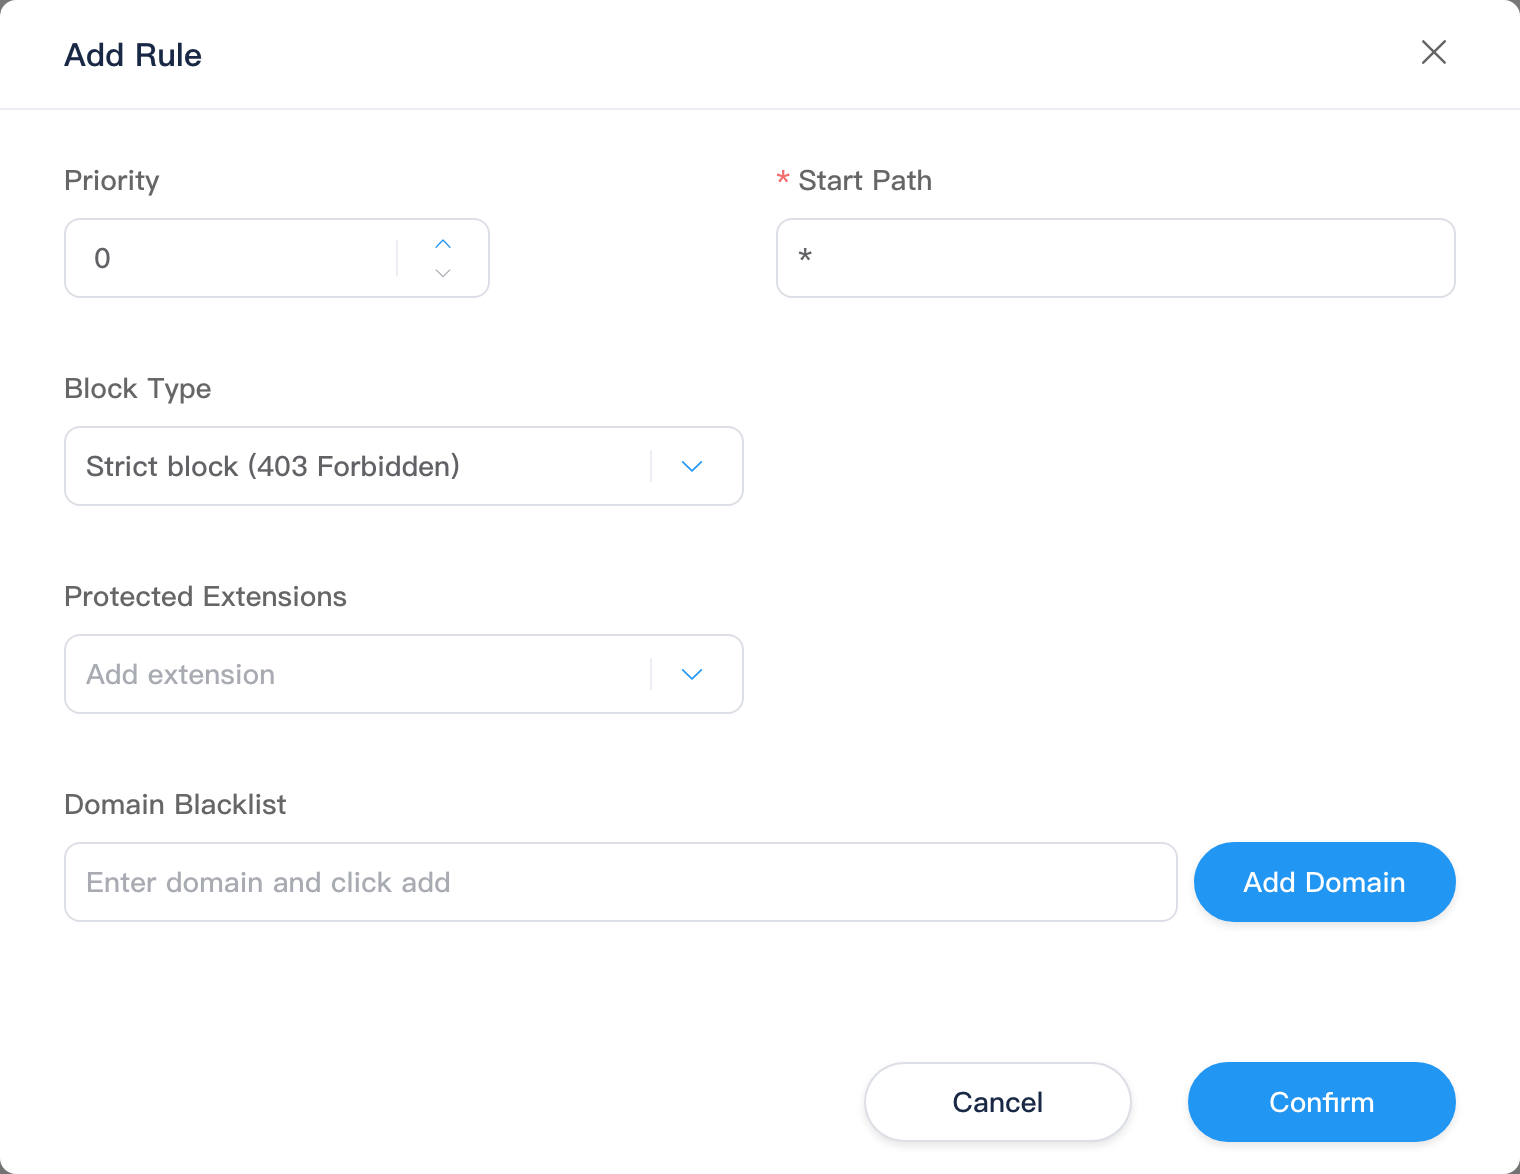
Add / Edit Rule Dialog
Configure: start path, block type, redirect URL (when redirecting), watermark text/opacity/color/font size/position, protected extensions, blacklist domains, etc.
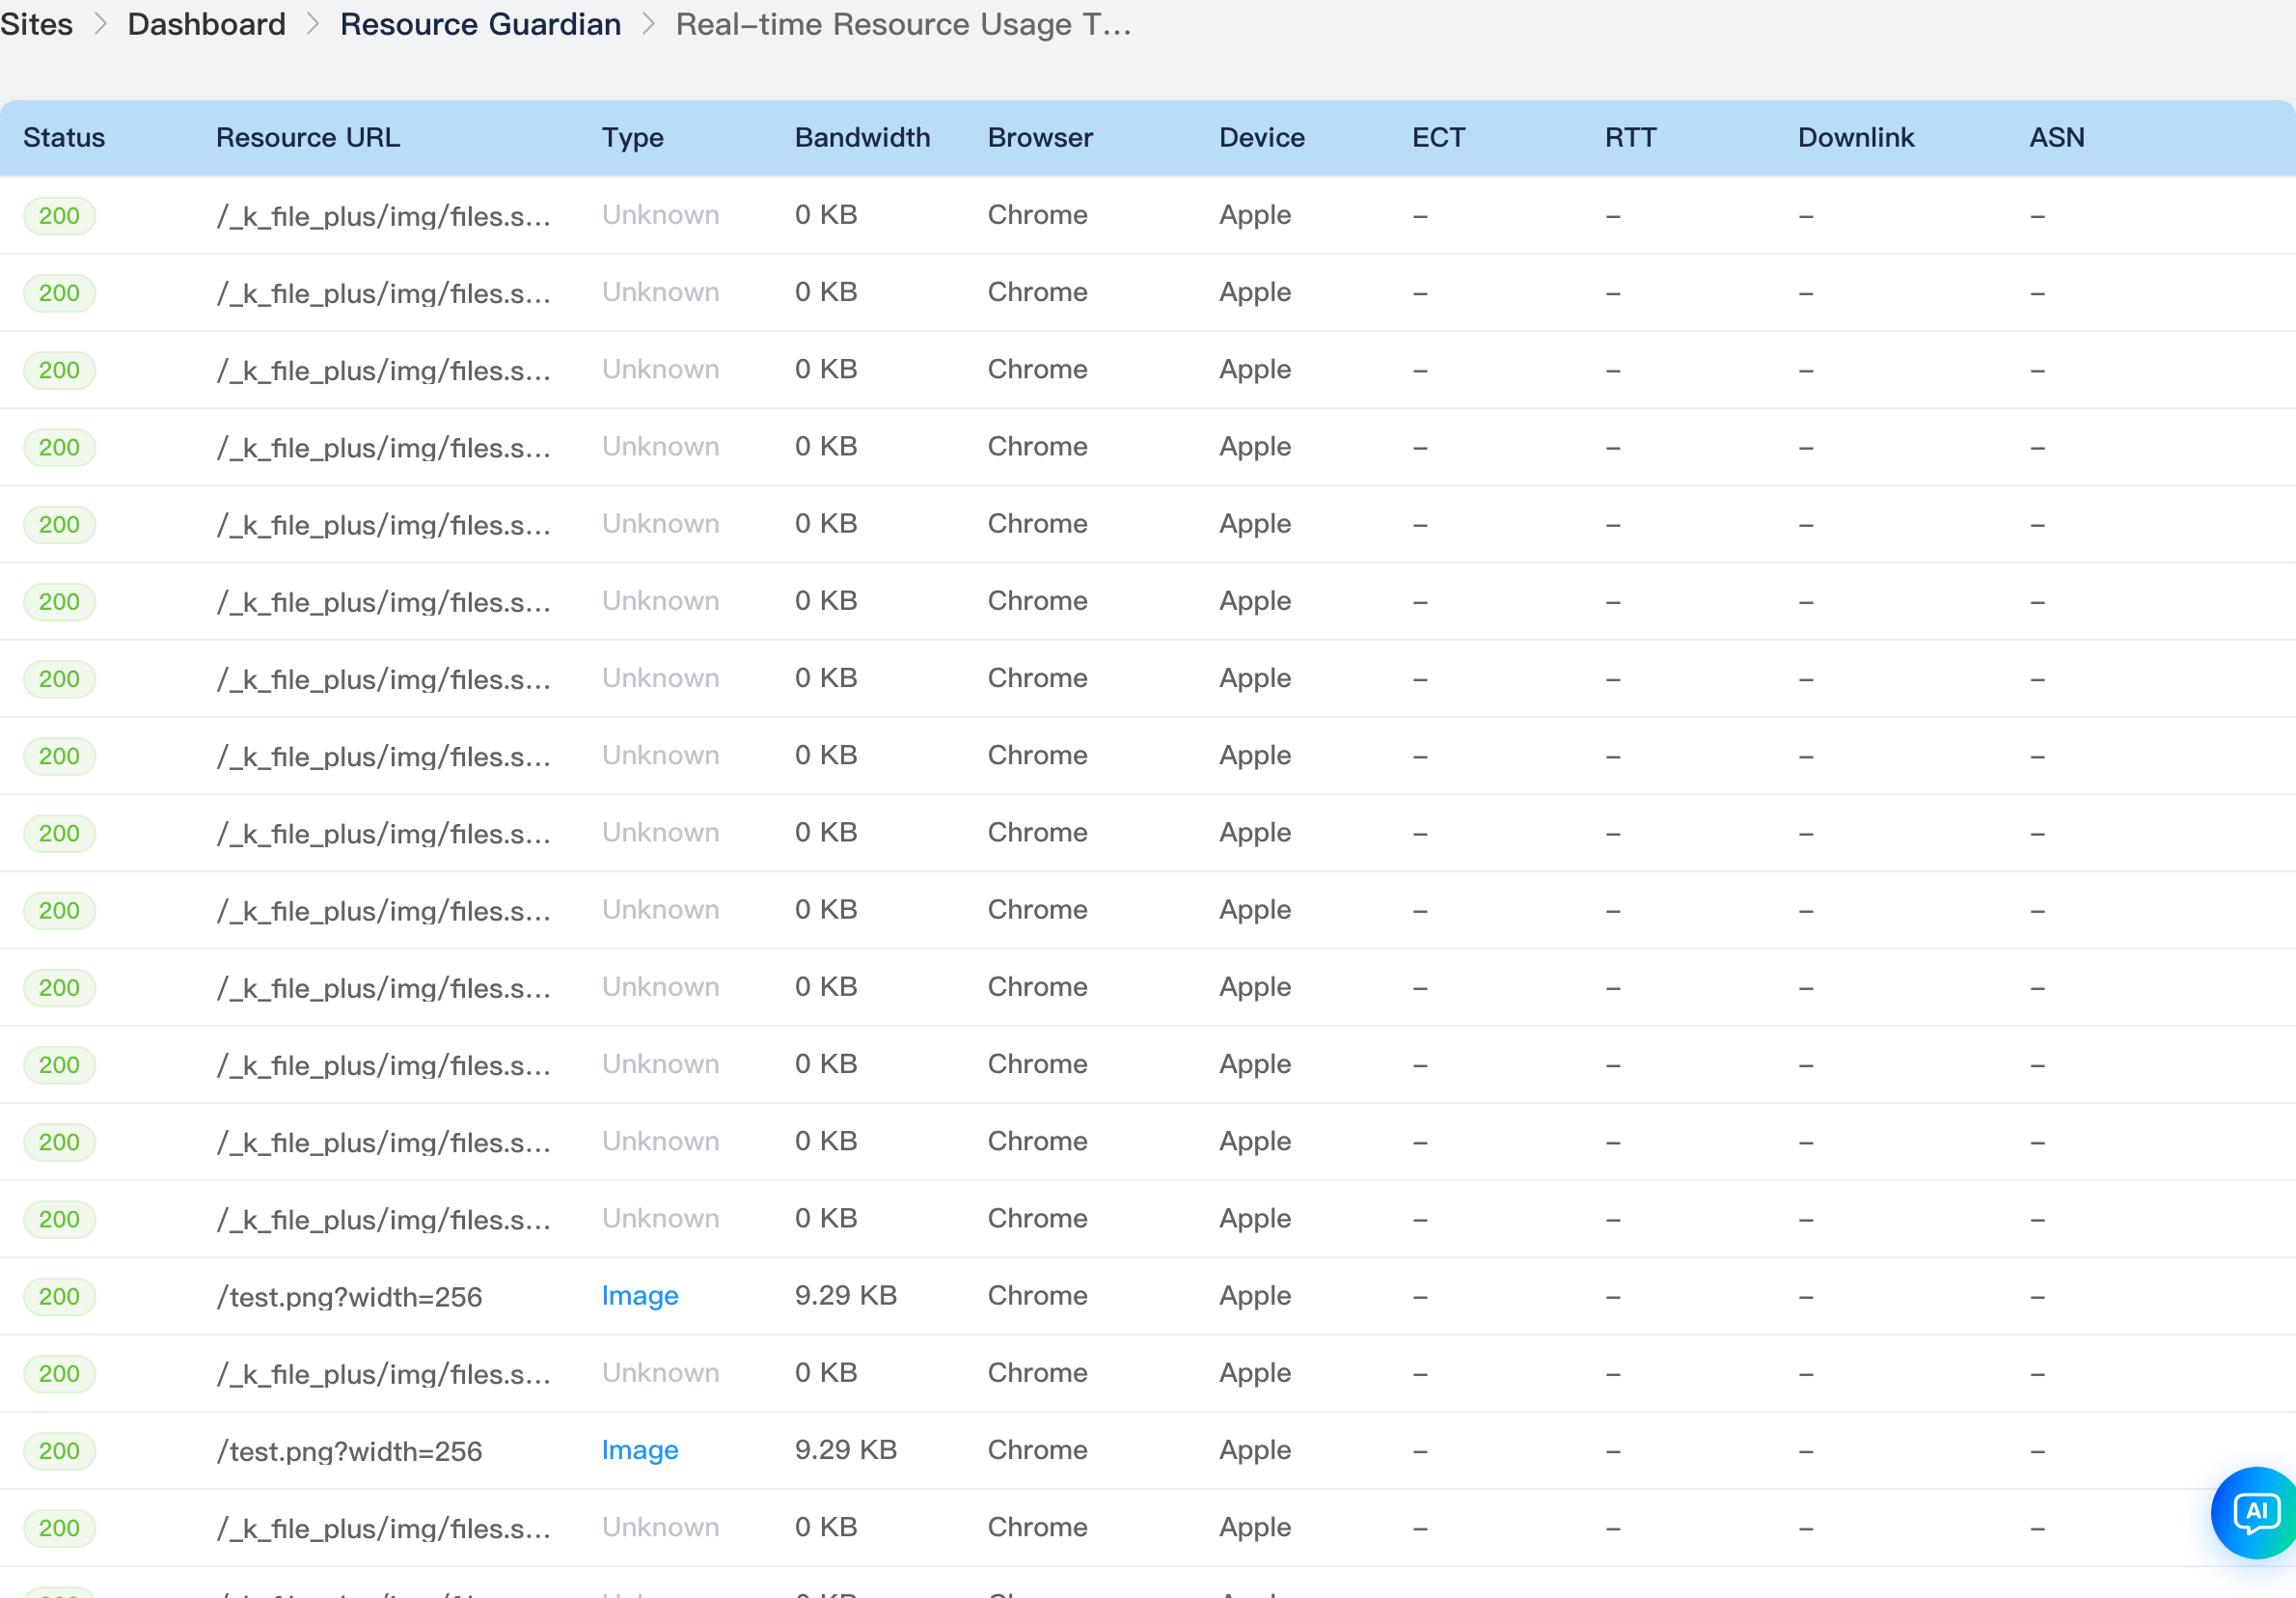
Resource Log Subpage
Path: /_Admin/system/resource-guardian/log-list?SiteId=...
Breadcrumb: Resource Guardian → Live Resource List and Usage Tracking. Full paginated list: Status, Resource URL, Type, Bandwidth, etc. (per UI columns).
Resource logging disabled
When header Enable is off, main stats and charts are empty with a "resource logging not enabled" message; turn on to view request logs and traffic stats. Protection rules can be configured in advance; Site Protection must also be on to take effect.
Related
- Operations Center overview
- Visitor Logs — site-wide visitors and page visits
- Site Settings — resource CDN, cache, etc. (dedicated topic pending)